Analytics
Analytics shows delivery health and flow for a workspace, without requiring iterations. Open a workspace and select Analytics.
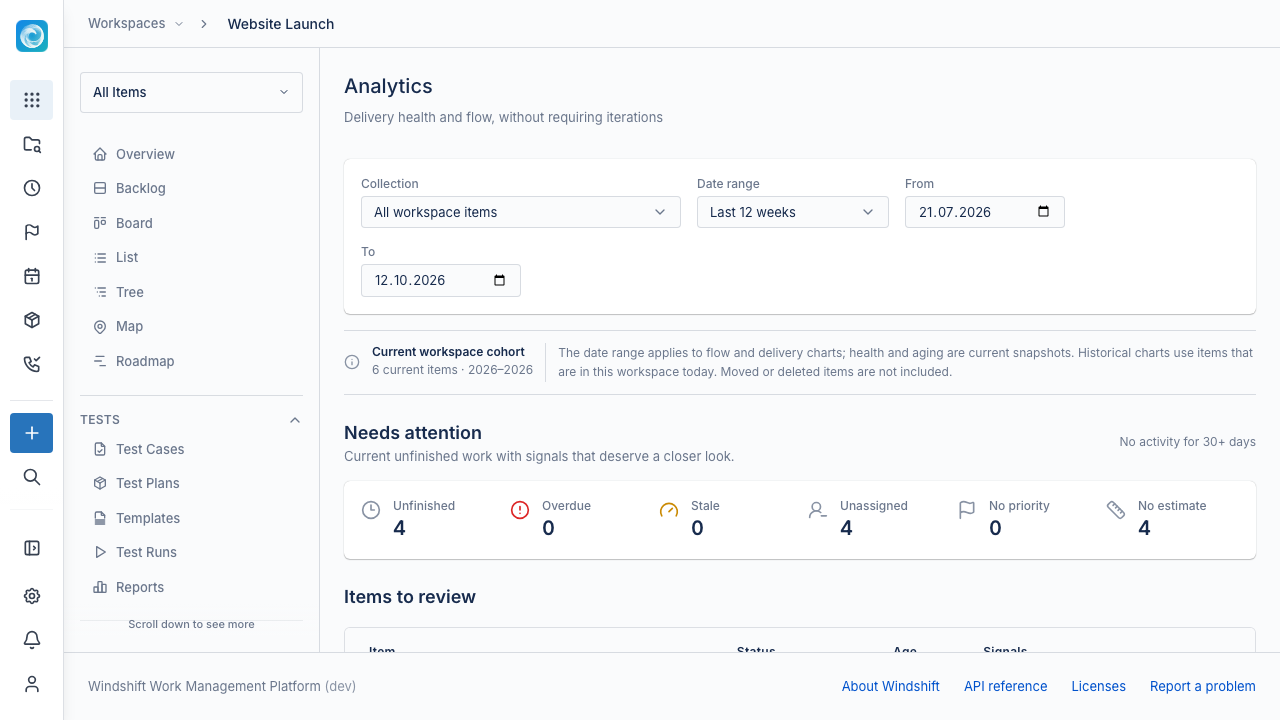
Scope and date range
Choose a preset range: the last 30 days, the last 12 weeks, the last 6 months, or the last year. You can also set a custom range of up to 366 days. You can also scope the page to a collection.
The date range applies to the flow and delivery charts. Health and aging views are current snapshots. Historical charts use items that are in the workspace or collection today, so moved or deleted items are not included.
Needs attention
The Needs attention section lists current unfinished items with signals:
- Overdue
- Stale (no activity for a set number of days)
- Unassigned
- No priority
- No estimate
Each row shows the item, its status, its age, and the signals that apply.
Created vs completed
The Created vs completed chart shows weekly arrivals and first completions. Completion means the first transition into a completed status. Reopening an item does not change its original completion.
The section shows the net change and the average number completed per week.
Aging work in progress
This section shows how long currently unfinished items have been open. It shows the total active items, the median age, and the 85th percentile. It also shows an age band distribution, the age by status, and the oldest unfinished items.
Delivery time
Delivery time measures creation to first completion, grouped by completion week. It shows the average, median, and 85th percentile, plus the longest delivery times. Windshift excludes items without completion history and reports them.
Data table
Select View data table to see the underlying numbers behind the charts.